This is the set of notes, discussion, and links that I have collected relating to the Japanese nuclear crisis of March 2011.
It represents the evolution of daily events as well as longer term analysis.
This document is nearing its final form but there probably will be some updates over the next few months and year.
Some items on this page:
A few links that I have collected are given below. They represent a variety of sources from popular media reports to government sources. These notes are my personal research. Some of the links are useful but this collection is not complete by any means.
What units are used for radiation levels? Sieverts and other units for radiation levels are discussed here. Also see the Wikipedia discussion on radiation levels.
Some facts on radiation are given on this blog.
Some health questions on radiation are answered by Bloomberg.
See the excellent Wikipedia discussion of the incident. More: radiation. Compare to Chernobyl.
Self sacrifice.
Some articles on radiation: [1, 2, 3, 4, 5].
U. S. government: DOE information. Also see the NNSA for information.
Here is a list of some of my thoughts and notes as this event progresses. The dates are approximate and some overlap occurs.
I am an analytical person and I find myself clamoring for some numbers to try to quantitatively summarize the situation. Many of the above links give popular media accounts. The press initially reported numbers in the range of 8000 micro Sieverts. Some other newspapers gave numbers like 10000 microsierverts. Then later into the incident I found a reported number of 400 milli Sieverts. (These sources are not mentioned.) The Wikipedia page gives a summary of radiation levels by day. The reported levels can vary a lot and a good question is what the real numbers are.
DOE radiation monitoring data was released on March 25. This excellent source of data from DOE gives some numbers based on their arial surveillance. This DOE presentation from March 25 gives some interesting graphs and numbers. It compares data from March 17, 18, and 19, and compares it to data taken on March 24. The conclusions that they list are that peak exposure rates have decreased over this time period. Of course these results are tentative.
The report cites some numeric data. A key point to note in this report is that the peak radiation does not exceed 30 mR/hr. Using the conversion 1 rem = 10 m Sv, this maximum radiation level converts to 300 micro Sieverts/hr or 0.3 milli Sieverts/hr. See the Wikipedia discussion on benchmark levels. This level is above normal but it not at a level as high as some of the popular press reports might imply.
The data here is two days old and of course the future direction is not clear. For example a serious breach might be possible.
Accounts are becoming more specific regarding radiation levels.
Trouble in Japan continues. The story is no longer commanding the top news slices but it is still on the front page of MSNBC and is a top news story at Google News. This has been a top news item for 2 1/2 weeks.
This story continues to get front page billing. It was commented that the situation appears still to be very out of control.
Well the very bad news is continuing.
With the crisis going on three weeks the level of interest is diminishing rapidly.
I am waiting until after the weekend and until probably Tuesday for more arial DOE radiation measurements.
This is the first day in a while in which neigher Google News nor MSNBC lists the Japan nuclear incident on its main page. If you look around you can still find stories though. Although plutonium's half life is around 750 million years, the half life of the media (i.e., the "public attention span") seldom extends for more than a month, and is usually around a week to several days.
There is not a lot of top news on the Japanese nuclear situation. This is probably good news. DOE probably will be continuing its radiation monitoring updates every few days. Otherwise there are still important articles such as on whether America is ready for a nuclear emergency. The frequency of information in this daily section will probably be increasing and I am expecting fewer daily notes. I do expect to continue with the analysis section below. I will probably be updating the analysis for months to come, but more slowly. I am also continuing to do follow up work on the oil spill as well, and once the major news blitz is over, it is interesting to see what truth comes out. Both of these incidents obviously are unfortunate catastrophes.
    About 70% of the fuel rods in the No. 1 reactor have been
    damaged, the report states. In reactor No. 2, that figure is 30%,
    and in No. 3, 25%.
More: [2].We do some calculations and brief analysis based on data from the DOE site. Specifically radiation data was collected and graphed. The PowerPoint presentations referenced from that site contain excellent graphic and other summary information. Some of that is summarized and analyzed below.
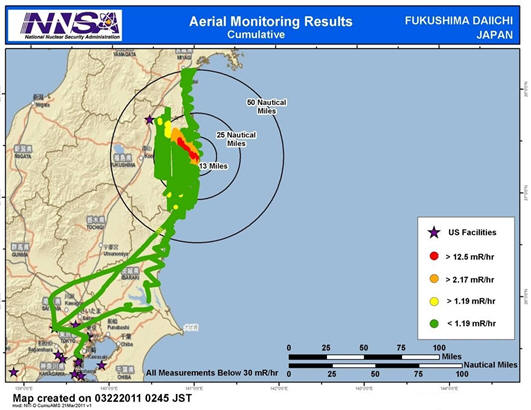
We summarize radiation findings by presenting a sequence of graphics depicting the evolving radiation patterns over time. The March 22 report shows radiation as summarized in the graphic below.
The red area shows where the radiation levels are over 12.5 milli Rem per hour.
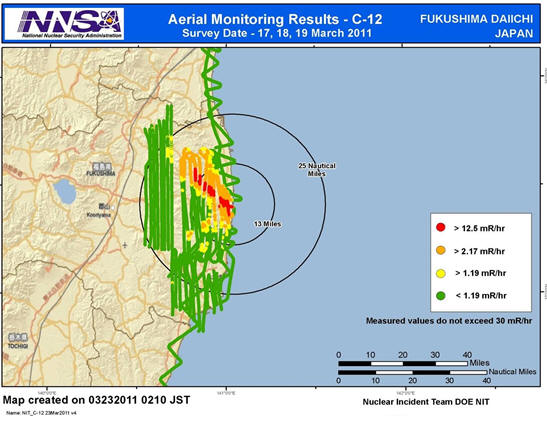
Data collected on March 17-19 is given below. (These are arial flights and the white areas are where there is no data.)
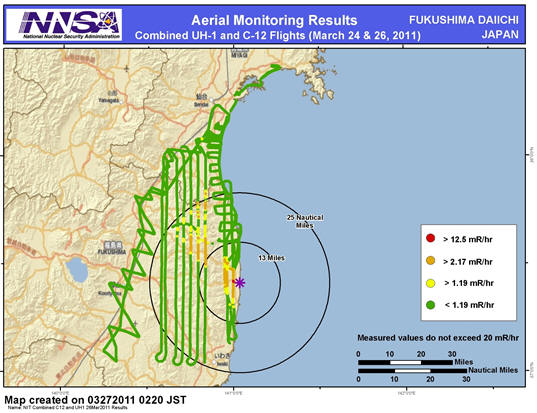
Data from March 24 and 26 show diminishing but spreading radiation.
Finally we show radiation levels at farther out areas.
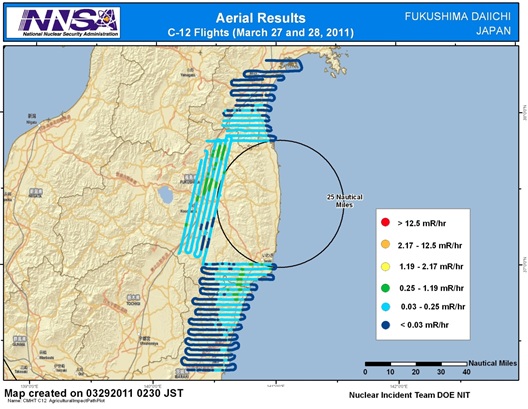
Data from March 30 to April 3 shows a larger area including Tokyo.
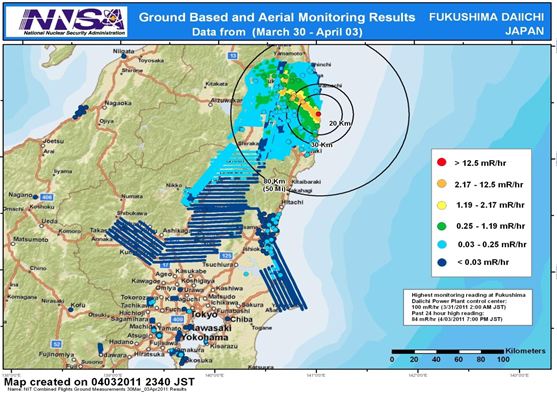
The numbers 12.5 mR/hr, 2.17 mR/hr, and so on are critical points in the preceding three graphics. The chart below gives a summary of these levels when converted into different units.
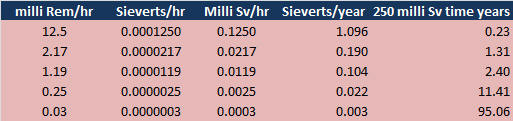
The right column above is the number of years it would take at this radiation level to reach a dose of 250 mSv, which is a "knee" point above which exposure can be dangerous. People in the green areas would receive 250 mSv in 2.4 years.
We also do a brief analysis of the radiation level given in the "farther out" dark blue areas. This is the level where the radiation is less than 0.03 milli Rem/hr. This level "poses no known health risk" according to the DOE. At this level, it takes more than 95 years to achieve a total of 250 milli Sv. Using the number 6.2 mSv/year as the average yearly dose for Americans (ref) we do some comparisons. Surprisingly, 42.4% of the dose 6.2 milli Sieverts/year turns out to be 0.03 milli rem / hour. In other words, the radiation level in the dark blue areas is about 40% of the dose that a typical American gets in a year. And stated yet another way, the rate of 0.03 milli rem / hour is 2.63 milli Sv / year whereas the average American receives 6.2 mSv/year. So in the dark blue areas, people receive less than an additional 42.4% of radiation above the typical dose an American receives.
The above table assumes that the radiation levels are holding constant. For example, if the level 0.03 MR/hr held constant for 95.06 years, then one would receive 250 milli Sv. And this is not the case. The radiation levels will decrease over time. A prime constituent is radioactive iodine, and that has a half life of around 8 days. Decreasing radiation over time is observed. The situation will be better than that given by the above table therefore.
A graphic released by the DOE on April 18 shows the expected radiation doses over a period of a year. This graphic is shown below.
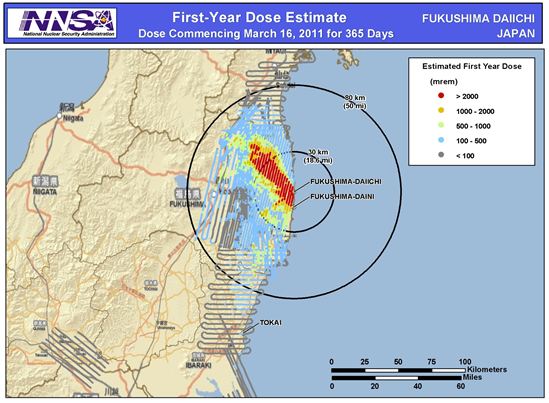
The number 2000 milli rem/year converts to 20 milli Sieverts/year. Dividing the milli rem/year value by 100 in the above legend gives the milli Sieverts/year value. (1 Sievert = 100 rems). The lowest level in gray corresponds to a yearly dose of 1 milli Sievert/year, a very low yearly dose.
As another note, I am not over criticizing the media's coverage because that field is difficult and competitive. The media's reporting of radiation levels and numbers seems to be accurate and I have little to criticize. In further defense of the media, besides the above notes, they need to be quick, and need to be there with a report in less than an hour.
by George Schils. Copyright 2011-2012 George Schils.
Note: The four graphic images excerpted from the referenced DOE document are probably in the public domain. No copyright is stated. However the conversion to the form used in this web page could be considered copyrighted to myself since they are based on my own investment in graphics tools, etc. although they are derived from public domain sources. If you are interested in obtaining these images please consult the original sources.